You can follow below steps to capture the deadlock graph using profiler. First we will setup the profiler and deadlock events and later on we will run the deadlock scenario.
Step 1: Open the SQL Profiler. You can start the SQL Profiler from the SSMS.
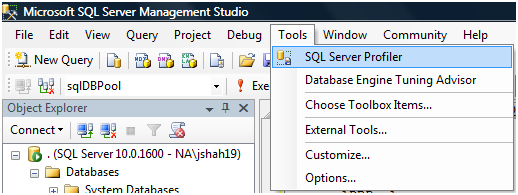
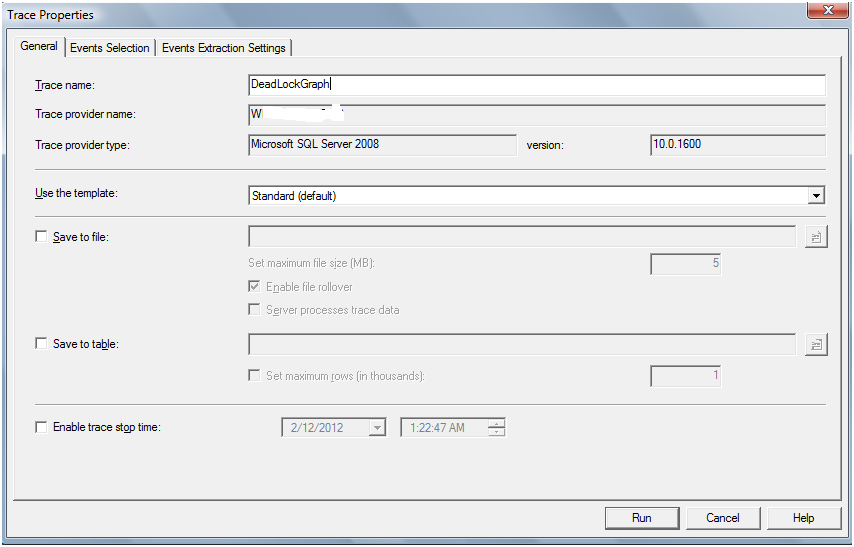
Step 2: Configure the trace, in General tab give the name to trace file.
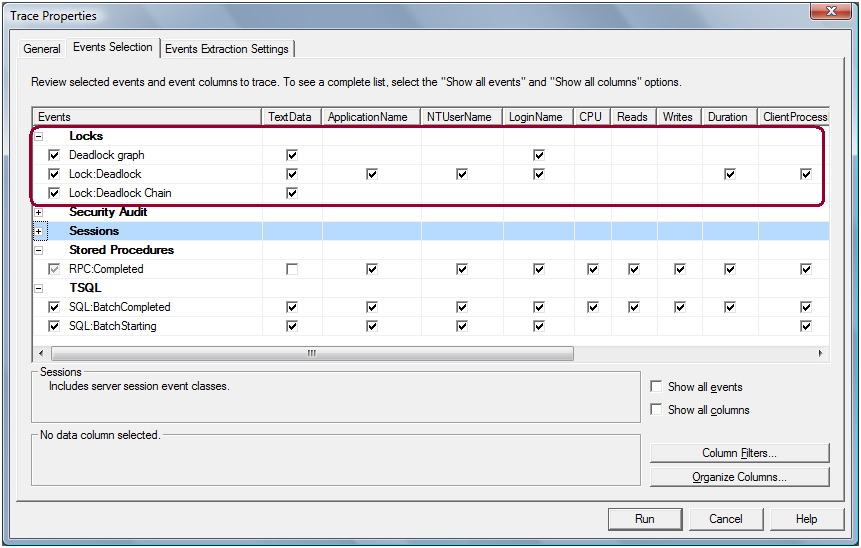
Step 3: Select the below events from the Event Selection tab and Run the trace.
Deadlock Graph
Deadlock Graph event captures deadlock in both XML format and graphically, a graph that shows us exactly the cause of the deadlock.
Lock:Deadlock
This event is fired whenever a deadlock occurs.
Lock:Deadlock Chain
This event is fired once for every process involved in a deadlock.
Step 4: Run the deadlock scenario queries as per http://sqldbpool.com/2012/02/12/steps-to-create-the-deadlock-scenario/ article.
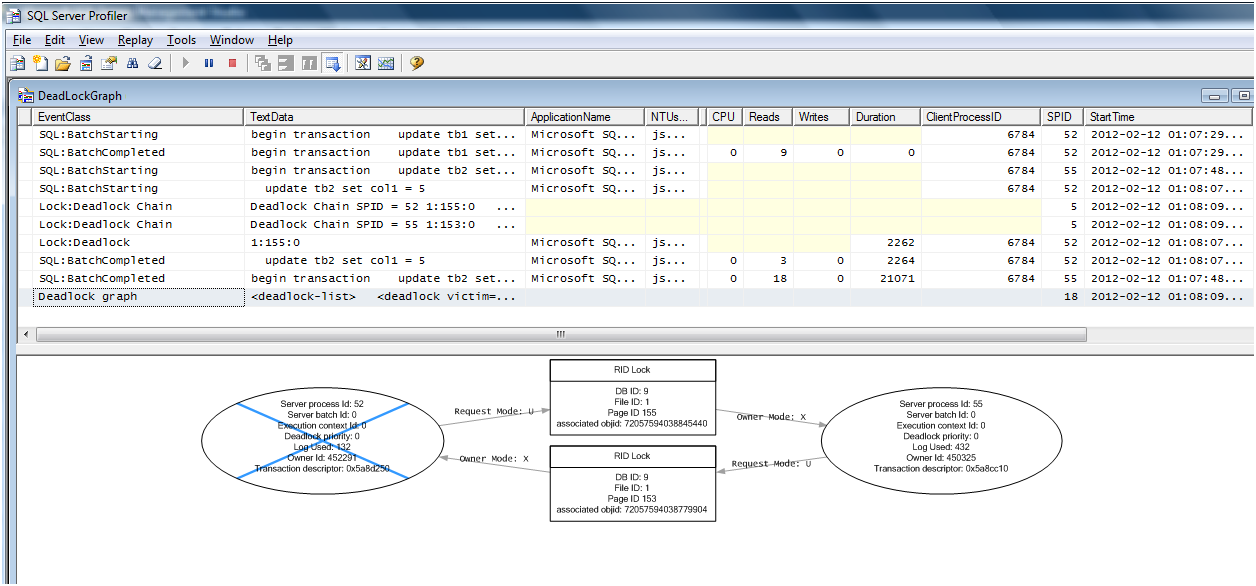
Step 5: You can see the below graph once the deadlock occurred.
2026 update: Profiler is deprecated — use Extended Events
SQL Server Profiler is on Microsoft’s deprecated list: avoid it in new work and use Extended Events instead. For deadlocks you have two better options. The system_health session already captures deadlock graphs for free on every instance. Or create a dedicated session:
CREATE EVENT SESSION [DeadlockCapture] ON SERVER
ADD EVENT sqlserver.xml_deadlock_report
ADD TARGET package0.event_file
    (SET filename = N'DeadlockCapture.xel');
GO
ALTER EVENT SESSION [DeadlockCapture] ON SERVER STATE = START;
The xml_deadlock_report event gives you the same graph Profiler did, at a fraction of the overhead — and it runs 24/7 without anyone remembering to start a trace.