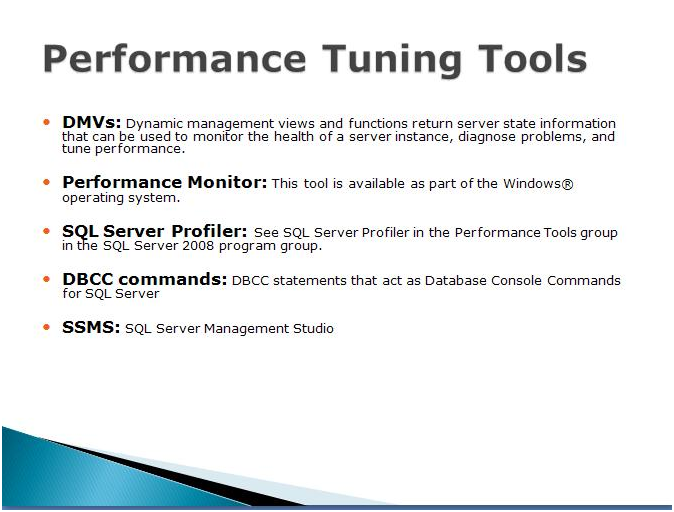
Category: Performance Tuning

  • DBCC DROPCLEANBUFFERS and CHECKPOINT

    DBCC DROPCLEANBUFFERS: is very useful command while doing the performance tuning of the queries. We can use DBCC DROPCLEANBUFFERS to test queries with a cold buffer cache without shutting down and restarting the server.

    Before we get into more detail, Let’s take a look sys.dm_os_buffer_descriptors DMV.

    sys.dm_os_buffer_descriptors
    Returns information about all the data pages which are currently in the SQL Server buffer pool, Output of the DMV will help us to determine the distribution of database pages in the buffer pool.

    As you might know, when a data page is read from disk, it will first copy to buffer pool and cached for reuse. Each cached data page has one buffer descriptor.

    Sys.dm_os_buffer_descriptors returns cached pages for all user and system databases.

    You can use below query to check the buffer descriptor for the current database.

    use SQLMonitor
    select sysObj.name,* 
    from sys.dm_os_buffer_descriptors bufferDescriptors
    INNER JOIN sys.allocation_units AllocUnits ON bufferDescriptors.allocation_unit_id = AllocUnits.allocation_unit_id
    INNER JOIN sys.partitions Partitions ON AllocUnits.container_id = Partitions.hobt_id
    INNER JOIN sys.objects sysObj ON Partitions.object_id = sysObj.object_id
    WHERE bufferDescriptors.database_id = DB_ID()
    AND sysObj.is_ms_shipped = 0
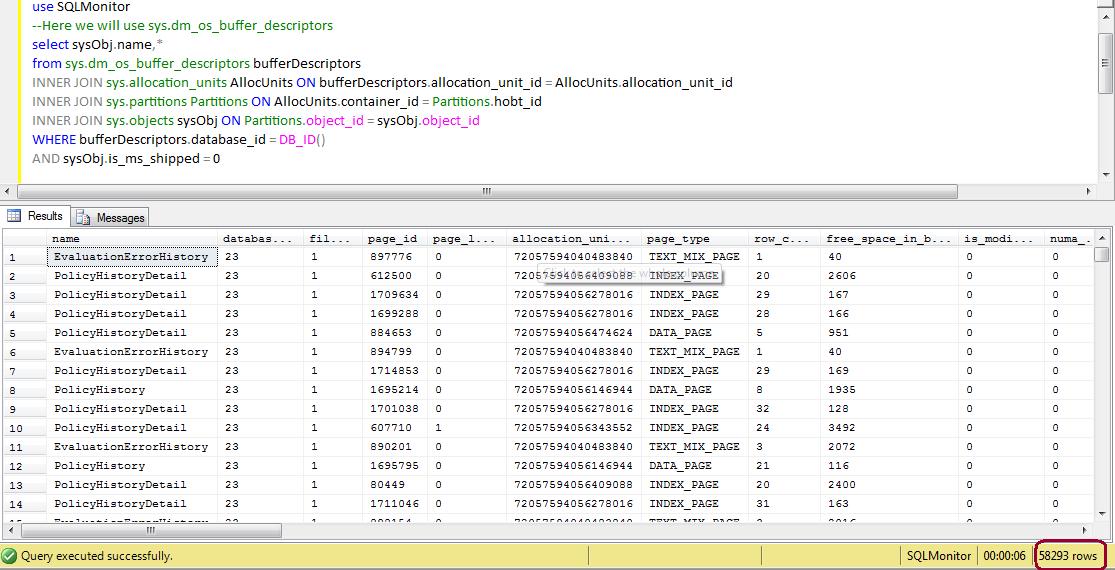
    

    From the above image, you can see that query has return 58293 rows, which means that number of pages. Now let’s execute the DBCC DROPCLEANBUFFERS:, it should clear all the pages.

    Execute below command, and again execute the sys.dm_os_buffer_descriptors bufferDescriptors query.

    DBCC DROPCLEANBUFFERS
    
    use SQLMonitor
    select sysObj.name,* 
    from sys.dm_os_buffer_descriptors bufferDescriptors
    INNER JOIN sys.allocation_units AllocUnits ON bufferDescriptors.allocation_unit_id = AllocUnits.allocation_unit_id
    INNER JOIN sys.partitions Partitions ON AllocUnits.container_id = Partitions.hobt_id
    INNER JOIN sys.objects sysObj ON Partitions.object_id = sysObj.object_id
    WHERE bufferDescriptors.database_id = DB_ID()
    AND sysObj.is_ms_shipped = 0
    

    See the results of sys.dm_os_buffer_descriptors, still it has return 154 rows which means all the pages from buffer pool is not cleared.
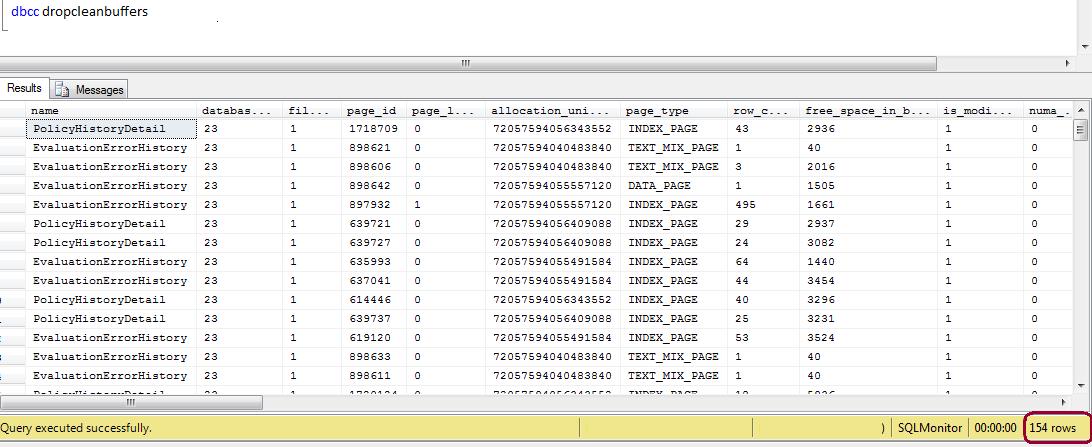
    The ideal method to clean the buffer pool is, you have to execute the CHECKPOINT command before executing the DBCC DROPCLEANBUFFERS command.

    CHECKPOINT Writes all dirty pages for the current database to disk. Dirty pages are data pages that have been entered into the buffer cache and modified, but not yet written to disk. Checkpoints save time during a later recovery by creating a point at which all dirty pages are guaranteed to have been written to disk.

    CheckPoint will help us to produce the cold buffer cache.

    --Execute the checkpoint command
    CHECKPOINT
    --Execute DBCC
    DBCC DROPCLEANBUFFERS
    --Execute below query to check the buffer descriptors
    use SQLMonitor
    select sysObj.name,* 
    from sys.dm_os_buffer_descriptors bufferDescriptors
    INNER JOIN sys.allocation_units AllocUnits ON bufferDescriptors.allocation_unit_id = AllocUnits.allocation_unit_id
    INNER JOIN sys.partitions Partitions ON AllocUnits.container_id = Partitions.hobt_id
    INNER JOIN sys.objects sysObj ON Partitions.object_id = sysObj.object_id
    WHERE bufferDescriptors.database_id = DB_ID()
    AND sysObj.is_ms_shipped = 0
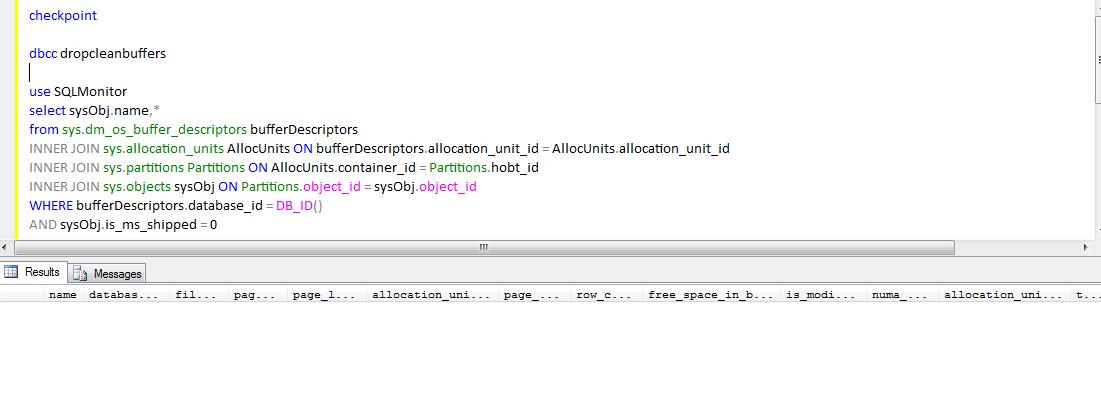
    

    I hope above explanation has clear all your doubts regarding how to DROPCLEANBUFFERS, Keep Reading…
  • SP_Configure

    Sp_Configure procedure is used to display or change the SQL Server setting. Once you execute the SP_Configure procedure it will display the below columns in the output.

    name – Name of the configuration parameter
    minimum – Minimum value setting that is allowed
    maximum – Maximum value that is allowed
    config_value – value which currently configured
    run_value – value which currently running

    How to update the configuration value?
    Here I will show you how to enable the XP_CmdShell using SP_Configure. Please note don’t update configuration values until you are sure, otherwise it will affect the your SQL Server performance and behavioral.

    --XP_Cmdshell is an andvanced option, enbale the advanced option
    EXEC sp_configure 'show advanced options', 1
    GO
    --Enable the advance option
    RECONFIGURE
    GO
    --enable the xp_cmdshell
    EXEC sp_configure 'xp_cmdshell', 1
    GO
    --Reconfigure the xp_cmdshell value
    RECONFIGURE
    GO
    

    What is the difference between Config_Value and Run_Value?

    When we change the Configuration Parameter value as above it will update the Config_Value filed only, but wouldn’t be in effect until you run reconfigure command. Once the reconfigure command execute or SQL Server restarted, SQL Server will run as per the new configured value.

    You can get the description of the configuration parameters from books online or you can query sys.configurations and check for the description column.

    select
    *
    from
    sys.configurations

    Output of the Sp_Configure

    Name

    Minimum Maximum Value Run Value

    access check cache bucket count

    0

    16384

    0

    0

    access check cache quota

    0

    2147483647

    0

    0

    Ad Hoc Distributed Queries

    0

    1

    0

    0

    affinity I/O mask

    -2147483648

    2147483647

    0

    0

    affinity mask

    -2147483648

    2147483647

    0

    0

    Agent XPs

    0

    1

    1

    1

    allow updates

    0

    1

    0

    0

    awe enabled

    0

    1

    0

    0

    backup compression default

    0

    1

    0

    0

    blocked process threshold (s)

    0

    86400

    0

    0

    c2 audit mode

    0

    1

    0

    0

    clr enabled

    0

    1

    0

    0

    common criteria compliance enabled

    0

    1

    0

    0

    cost threshold for parallelism

    0

    32767

    5

    5

    cross db ownership chaining

    0

    1

    0

    0

    cursor threshold

    -1

    2147483647

    -1

    -1

    Database Mail XPs

    0

    1

    0

    0

    default full-text language

    0

    2147483647

    1033

    1033

    default language

    0

    9999

    0

    0

    default trace enabled

    0

    1

    1

    1

    disallow results from triggers

    0

    1

    0

    0

    EKM provider enabled

    0

    1

    0

    0

    filestream access level

    0

    2

    0

    0

    fill factor (%)

    0

    100

    0

    0

    ft crawl bandwidth (max)

    0

    32767

    100

    100

    ft crawl bandwidth (min)

    0

    32767

    0

    0

    ft notify bandwidth (max)

    0

    32767

    100

    100

    ft notify bandwidth (min)

    0

    32767

    0

    0

    index create memory (KB)

    704

    2147483647

    0

    0

    in-doubt xact resolution

    0

    2

    0

    0

    lightweight pooling

    0

    1

    0

    0

    locks

    5000

    2147483647

    0

    0

    max degree of parallelism

    0

    64

    0

    0

    max full-text crawl range

    0

    256

    4

    4

    max server memory (MB)

    16

    2147483647

    2147483647

    2147483647

    max text repl size (B)

    -1

    2147483647

    65536

    65536

    max worker threads

    128

    32767

    0

    0

    media retention

    0

    365

    0

    0

    min memory per query (KB)

    512

    2147483647

    1024

    1024

    min server memory (MB)

    0

    2147483647

    0

    0

    nested triggers

    0

    1

    1

    1

    network packet size (B)

    512

    32767

    4096

    4096

    Ole Automation Procedures

    0

    1

    0

    0

    open objects

    0

    2147483647

    0

    0

    optimize for ad hoc workloads

    0

    1

    0

    0

    PH timeout (s)

    1

    3600

    60

    60

    precompute rank

    0

    1

    0

    0

    priority boost

    0

    1

    0

    0

    query governor cost limit

    0

    2147483647

    0

    0

    query wait (s)

    -1

    2147483647

    -1

    -1

    recovery interval (min)

    0

    32767

    0

    0

    remote access

    0

    1

    1

    1

    remote admin connections

    0

    1

    0

    0

    remote login timeout (s)

    0

    2147483647

    20

    20

    remote proc trans

    0

    1

    0

    0

    remote query timeout (s)

    0

    2147483647

    600

    600

    Replication XPs

    0

    1

    0

    0

    scan for startup procs

    0

    1

    0

    0

    server trigger recursion

    0

    1

    1

    1

    set working set size

    0

    1

    0

    0

    show advanced options

    0

    1

    1

    1

    SMO and DMO XPs

    0

    1

    1

    1

    SQL Mail XPs

    0

    1

    0

    0

    transform noise words

    0

    1

    0

    0

    two digit year cutoff

    1753

    9999

    2049

    2049

    user connections

    0

    32767

    0

    0

    user options

    0

    32767

    0

    0

    xp_cmdshell

    0

    1

    1

    1

  • Performance Tuning – Wait Statistics

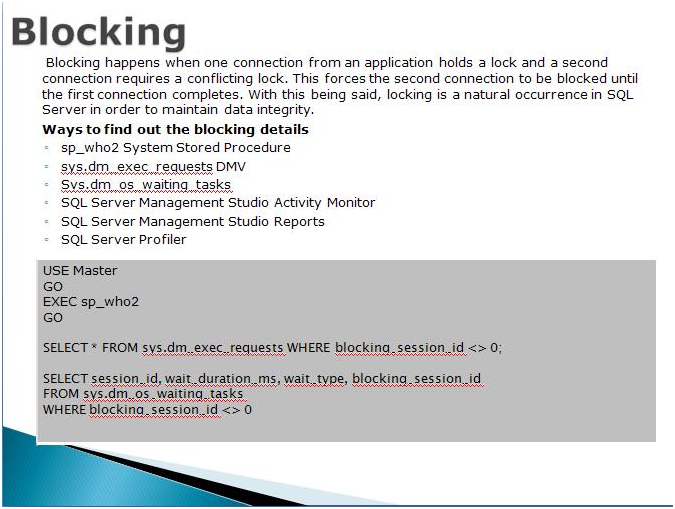
    Many times we got a call from the business team regarding the performance issue on the database server. As a first step you can check for the blocking, if the blocking is not there. We have to check for the waits, Query is internally waiting for the resources to complete its process.

    By identifying the correct wait type will give you the directions to troubleshooting issue further. You can execute below query to get the 10 wait statistics.

    SELECT TOP 10
            wait_type ,
            max_wait_time_ms wait_time_ms ,
            signal_wait_time_ms ,
            wait_time_ms - signal_wait_time_ms AS resource_wait_time_ms ,
            100.0 * wait_time_ms / SUM(wait_time_ms) OVER ( )
                                        AS percent_total_waits ,
            100.0 * signal_wait_time_ms / SUM(signal_wait_time_ms) OVER ( )
                                        AS percent_total_signal_waits ,
            100.0 * ( wait_time_ms - signal_wait_time_ms )
            / SUM(wait_time_ms) OVER ( ) AS percent_total_resource_waits
    FROM    sys.dm_os_wait_stats
    WHERE   wait_time_ms > 0
    ORDER BY wait_time_ms DESC
    

    You have to checkout for the below kind of wait statistics and troubleshoot as per the stats.

    CXPACKET :Most of the time it indicates nothing more than that certain queries are executing with parallelism; CXPACKET waits in the server are not an immediate sign of problems, it may be the symptom of another problem, associated with one of the other high value wait types in the instance.

    SOS_SCHEDULER_YIELD :The tasks executing in the system are yielding the scheduler, having exceeded their quantum, and are having to wait in the runnable queue for other tasks to execute. This may indicate that the server is under CPU pressure.

    THREADPOOL :A task had to wait to have a worker bound to it, in order to execute.

    LCK_* :These wait types indicate that blocking is occurring in the system and that sessions have had to wait to acquire a lock of a specific type, which was being held by another database session. This problem can be investigated further using, for example, the information in the sys.dm_db_index_operational_stats.

    PAGEIOLATCH_*, IO_COMPLETION, WRITELOG :These waits are commonly associated with disk I/O bottlenecks, though the root cause of the problem may be, and commonly is, a poorly performing query that is consuming excessive amounts of memory in the server.

    PAGELATCH_* :Non-I/O waits for latches on data pages in the buffer pool. A lot of times PAGELATCH_* waits are associated with allocation contention issues. One of the best-known allocations issues associated with PAGELATCH_* waits occurs in tempdb when the a large number of objects are being created and destroyed in tempdb and the system experiences contention on the Shared Global Allocation Map (SGAM), Global Allocation Map (GAM), and Page Free Space (PFS) pages in the tempdb database.

    LATCH_* :These waits are associated with lightweight short-term synchronization objects that are used to protect access to internal caches, but not the buffer cache. These waits can indicate a range of problems, depending on the latch type. Determining the specific latch class that has the most accumulated wait time associated with it can be found by querying the sys.dm_os_latch_stats DMV.

    ASYNC_NETWORK_IO :This wait is often incorrectly attributed to a network bottleneck.

  • Performance Tuning Series

    Lock Pages in Memory

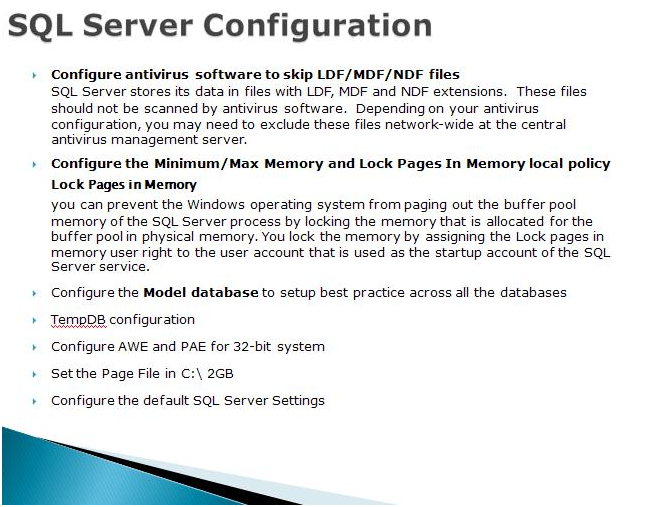
    You can prevent the Windows operating system from paging out the buffer pool memory of the SQL Server process by locking the memory that is allocated for the buffer pool in physical memory. You lock the memory by assigning the Lock pages in memory user right to the user account that is used as the startup account of the SQL Server service.

    Model Database Whenever we create a new database, it will use model as template. Configure model DB for the Auto Shrink OFF, Auto Update/Create Statistics on

    Maximum Worker Threads: Based on the load increase the maximum work thread.

    Address Windowing Extensions (AWE) is an API that allows a 32-bit application to manipulate physical memory beyond 4 GB memory limit. The AWE mechanism technically is not necessary on 64-bit platform. It is, however, present there. Memory pages that are allocated through the AWE mechanism are referred as locked pages on the 64-bit platform.

    On both 32-bit and 64-bit platforms, memory that is allocated through the AWE mechanism cannot be paged out. This can be beneficial to the application. (This is one of the reasons for using AWE mechanism on 64-bit platform.) This also affects the amount of RAM that is available to the system and to other applications, which might have detrimental effects. For this reason, in order to use AWE, the Lock Pages in Memory privilege must be granted for the account that runs SQL Server.


    Please note:

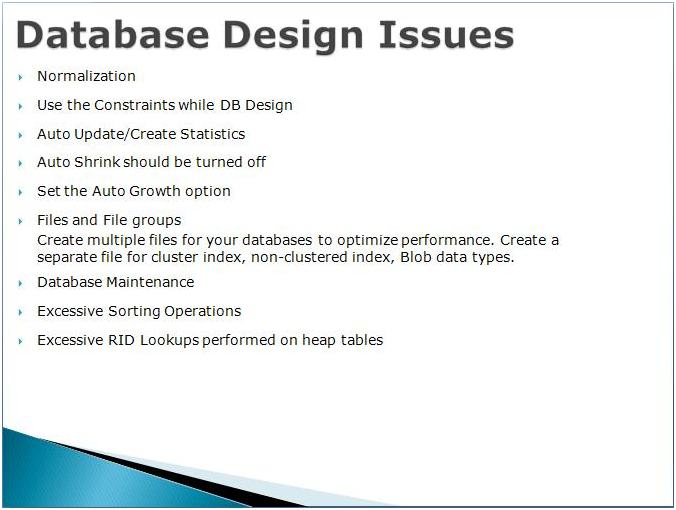
    • Turn auto-shrink off.
    • Make sure auto-update of statistics is turned on.
    • If a database is read only, set it to read only.
    • Use triggers very judiciously. They mostly operate in the background making them difficult to monitor and troubleshoot.
    • Be very careful of auto growth settings on the database. 10% auto growth will be fine when the database is 500mb. It makes a huge difference when the system is 50gb. For larger databases, change the setting to grow by a fixed amount rather than a percentage of total database size.
    • Files and FileGroups
    • Other factors that can affect the performance of your system include the way the files and file groups are laid out. You should be creating multiple files for your databases to optimize performance. A baseline for this would be to create one file for the logs, another for the data (defined by the clustered index), and another for non-clustered indexes. Additional files may be necessary to separate out BLOB data or XML data or unusually active tables, each onto its own file, and where possible, onto its own disk. This has been found to be true even on SAN systems because distributing the load takes further advantage of the architecture of the SAN.
    • Data Types
    • Define the data types that you need, not what you think you might need someday. A phone number is a string, not a number. Define the length of field that you need and enforce that length.

    .

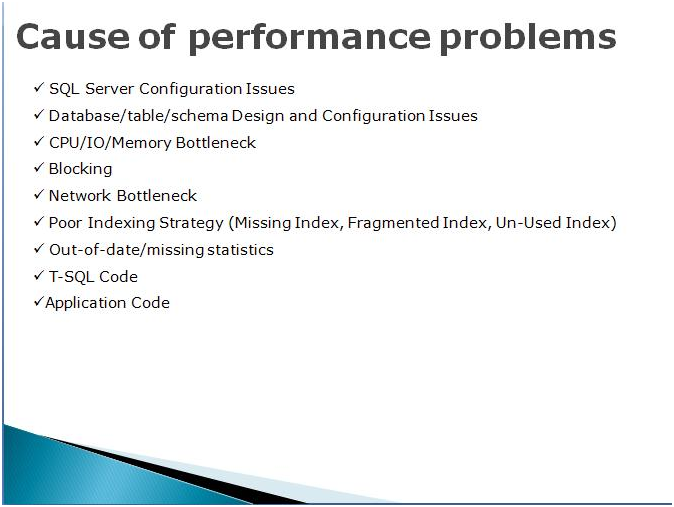
  • Common cause of the performance issues

    Below are the most common reasons for the performance issues.

    • SQL Server Configuration Issues
    • Database/table/schema Design and Configuration Issues
    • CPU/IO/Memory Bottleneck
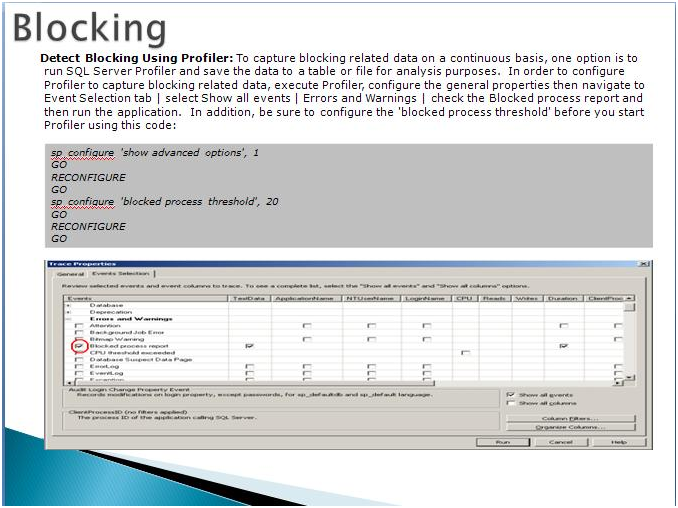
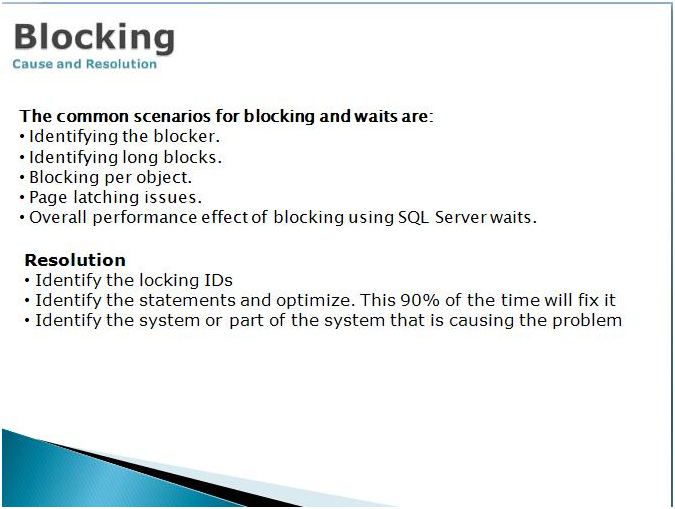
    • Blocking
    • Network Bottleneck
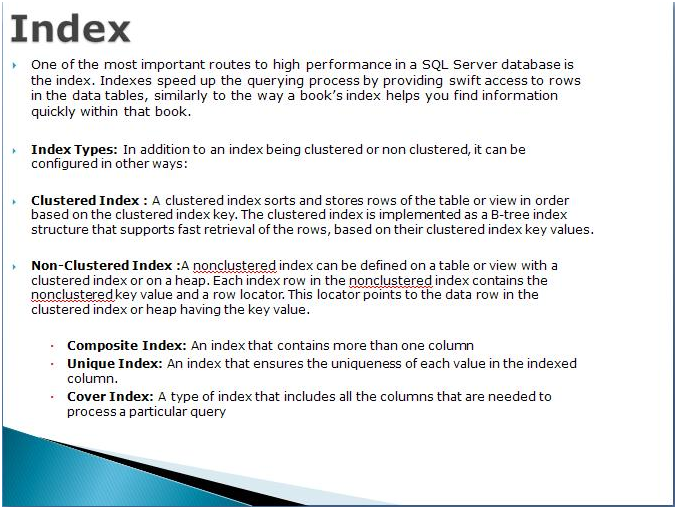
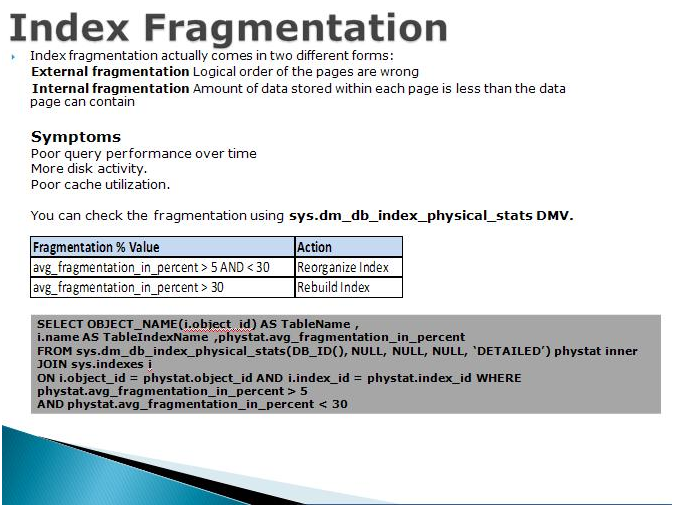
    • Poor Indexing Strategy (Missing Index, Fragmented Index, Un-Used Index)
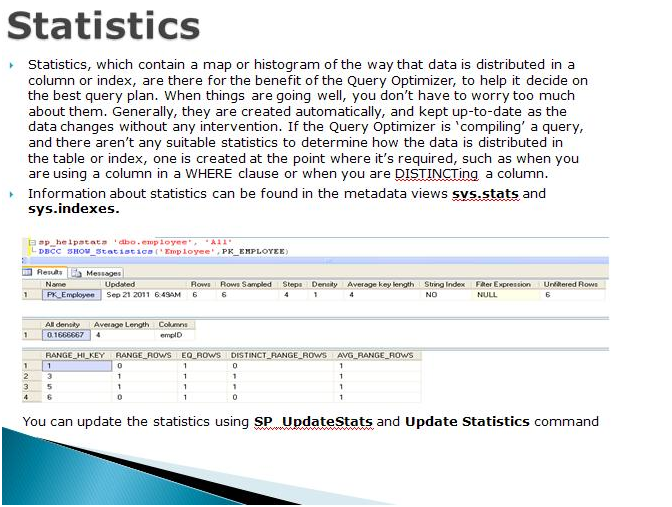
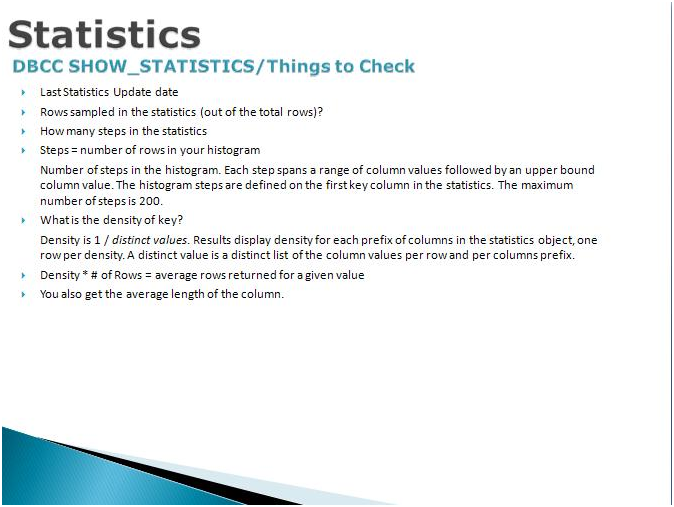
    • Out-of-date/missing statistics
    • T-SQL Code
    • Application Code