Category: Performance Tuning

  • SQL Profiler

    SQL Server Profiler is a graphical tool that helps in the monitoring of an instance of SQL Server Database Engine or Analysis Services. SQL Profiler is a tool which monitors the events and activity running on a SQL Server instance. The results can be saved to a file or inside a SQL Server table. We can replay this saved trace. Profiler is mostly used in stress testing a server, analyzing performance, debugging TSQ statements, and auditing SQL Server activity.

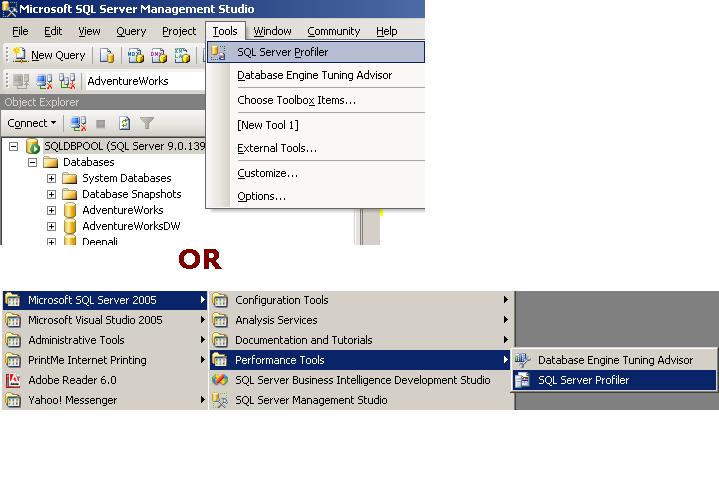
    See below image to see how to open SQL Profiler
    See below list for the Key terms associated with profiler.

    Event is an action that is generated within an instance of a SQL Server Database Engine. These could be login failure, connection failure or any disconnection. It will include events such as T-SQL statements, remote procedure call batch status, the start or end of a stored procedure, the start or end of statements within a stored procedure and so on.. These are displayed in the trace in a single row intersected by data columns with descriptive details.

    Event Class is an event that can be traced and contains all of the data that can be reported by the event. For example SQL: Batch completed for instance is an event class

    Event Category defines the methodology used for grouping events within the SQL Server Profiler. For instance lock events will be categorized under Lock event category.

    Data Column is an attribute of an event class that is captured in the trace.

    Template is the default configuration for a trace. It includes the event classes that are required for monitoring.

    Trace captures data based on selected event classes, data columns and filters.

    Filter Data can be filtered by specifying criteria of selection during the execution of an event. This feature is used to reduce the size of the Trace.
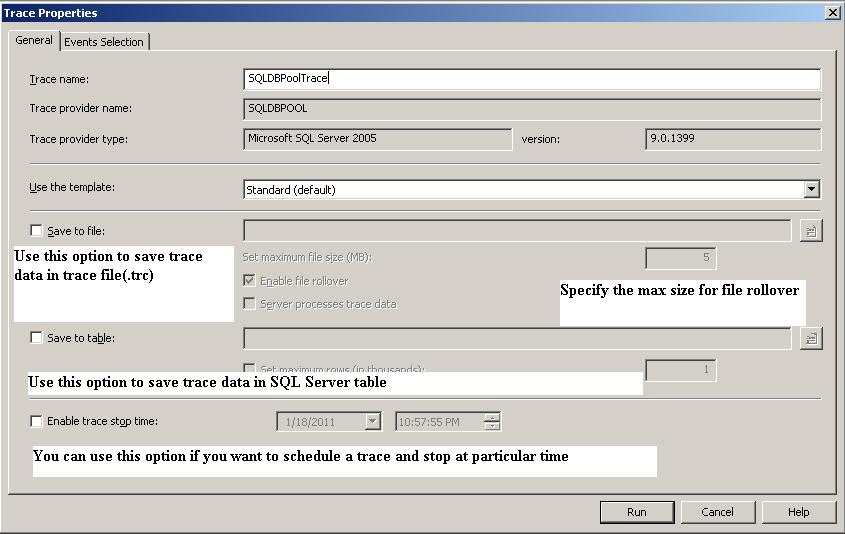
    Event Selection Tab
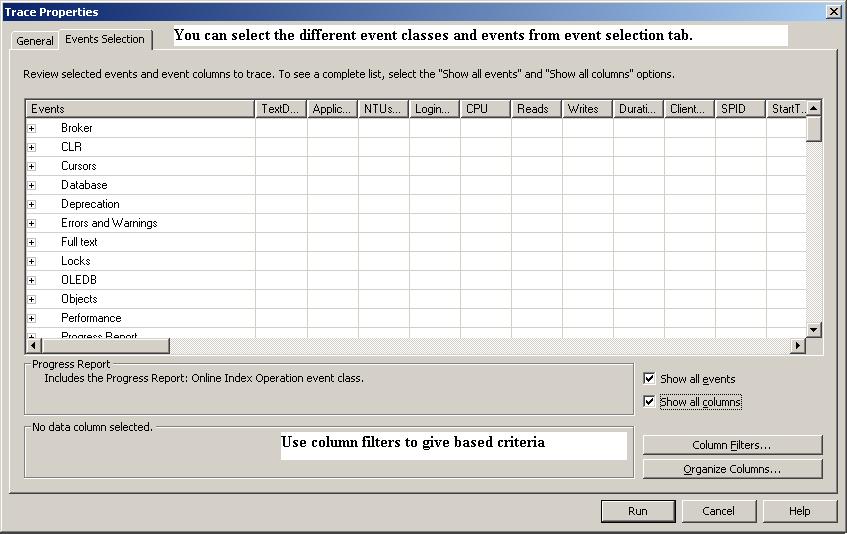
    You can use fn_trace_gettable function to read the trace file.

  • SQL Server 2005/2008 Standard Reports

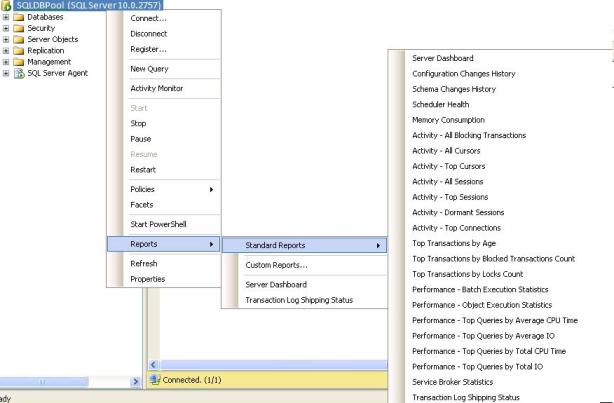
    In the new versions of SQL Server Microsoft has included very useful standard reports. We can use these different kind of report for performance-tuning, activity monitoring, Query tuning, troubleshooting IO bottlenecks.

    You can follow below steps to get the standard reports.
    Right Click On SQL Server -> Goto Reports -> Goto Standard Reports

  • Row Versioning in SQL Server 2005

    SQL Server 2005 has introduced two new Isolation Levels. We can use these Isolation Levels for row versioning.

    1. READ_COMMITTED_SNAPSHOT (statement level)
    2. ALLOW_SNAPSHOT_ISOLATION (transaction level)

    These Isolation level turned on database level. You can turn on the Isolation Level using below command.

    ALTER DATABASE sqldbpool
    SET READ_COMMITTED_SNAPSHOT ON

    ALTER DATABASE sqldbpool
    SET ALLOW_SNAPSHOT_ISOLATION ON

    When above Isolation level is turned on it will enable the row versioning at database level. Transaction or statement views the data as it existed at the start of the statement or transaction, instead of protecting all reads with locks. Row versioning will reduce the blocking/deadlock issues and boost the database performance. Row versioning also prevents users from reading uncommitted data and prevents multiple users from attempting to change the same data at the same time.

    You can query sys.databases to check the above isolation level status.

    SELECT name, snapshot_isolation_state_desc, is_read_committed_snapshot_on FROM sys.databases

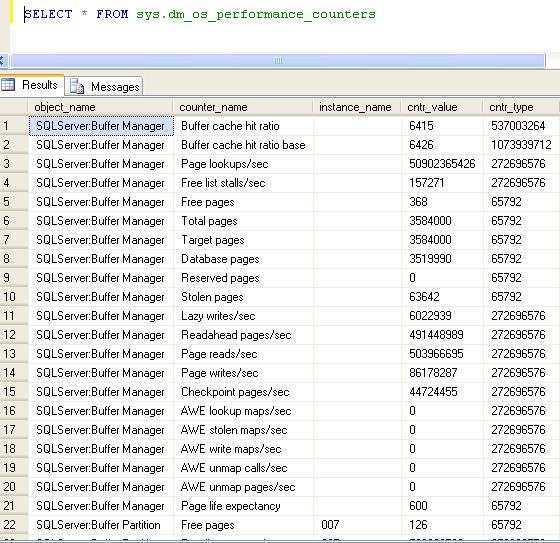
  • How to get data of SQL Server PerfMon Counters without running Performance Monitor tool?

    Execute the query againts sys.dm_os_performance_counters DMV to get the result.

    SELECT * FROM sys.dm_os_performance_counters

    sys.dm_os_performance_counters output
  • RAID Levels

    RAID Levels
    RAID 5:-  RAID 5 will provide good performance throughput and prevent data loss if there is a disk failure. For the database which has high read/write activity, RAID 5 will be a better choice when compared to RAID 0 and RAID 1 in terms of data availability and data protection. For an ideal SQL Server configuration, you should have a combination of RAID 1 and RAID 5. You should mirror the operating system using RAID 1, and place transaction logs on a RAID 1 that is separate from the RAID 1 that hosts the operating system. SQL Server writes data to the transaction logs and maintains serial information of all modifications that occurred in a SQL database. The transaction log files can be used for rollback and roll forward of information from a SQL Server database. The SQL Server files and filegroups should be placed on a RAID 5, because you get best performance throughput by placing database files on RAID 5 disk array.

    RAID 10 RAID 10 is a better choice than RAID 5, but RAID 10 would be more expensive than RAID 5. RAID 10 is a combination of RAID 0+1, which is known as striping with mirroring. You should first mirror disks and then create a stripe set of mirrored disks. This provides high fault tolerance for data and excellent throughput performance.

    RAID 1 RAID 1 is known as disk mirroring. You need a minimum of two disks to form a RAID 1 array. One primary disk is used for read/write operations and the data is replicated to the second disk. This RAID level offers better read performance but slower write performance.

    RAID 0 RAID 0 is known as disk striping. This RAID level stripes data across disks in the array, offering better throughput on the read/write operations. However, there is no data protection offered in this RAID level. If one disk fails, the data stored on the disk will be lost.