You can follow below steps to capture the deadlock graph using profiler. First we will setup the profiler and deadlock events and later on we will run the deadlock scenario.
Step 1: Open the SQL Profiler. You can start the SQL Profiler from the SSMS.

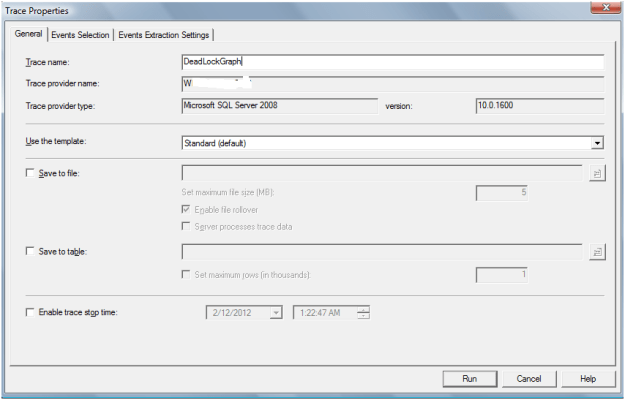
Step 2: Configure the trace, in General tab give the name to trace file.
Step 3: Select the below events from the Event Selection tab and Run the trace.
Deadlock Graph
Deadlock Graph event captures deadlock in both XML format and graphically, a graph that shows us exactly the cause of the deadlock.
Lock:Deadlock
This event is fired whenever a deadlock occurs.
Lock:Deadlock Chain
This event is fired once for every process involved in a deadlock.

Step 4: Run the deadlock scenario queries as per http://sqldbpool.com/2012/02/12/steps-to-create-the-deadlock-scenario/ article.
Step 5: You can see the below graph once the deadlock occurred.


very good article – thank you