Different ways to check the SQL Server Instance Port number

Problem: If there are multiple SQL instances running on the same computer, it is difficult to identify the instance port number. You can use the below solution to find the instance specific port numbers.

Solution: You can check the list of port number used by the SQL Server instances using one of the below way.

Soln 1# Using SQL Server Configuration Manager

  • Go to SQL Server Configuration Manager
  • Select Protocols for SQL2005/2008 under SQL server Network Configuration
  • Right click on TCP/IP and select Properties
  • Select the IP Addresses-tab
  • In the section IP ALL, you can see the ports

Soln 2#From Registry Values
SQL Server 2005
Type the regedit command in Run window and check the below registry values.HKEY_LOCAL_MACHINE\SOFTWARE\Microsoft\Microsoft SQL Server\MSSQL.#

HKEY_LOCAL_MACHINE\SOFTWARE\Microsoft\Microsoft SQL Server\ MSSQL.#\ MSSQLServer\ SuperSocketNetLib\TCP\IPAll

SQL Server 2008
Default instance
HKEY_LOCAL_MACHINE\SOFTWARE\Microsoft\Microsoft SQL Server\MSSQL10.MSSQLSERVER\MSSQLServer\SuperSocketNetLib\TCP\IPAll

Named instance
HKEY_LOCAL_MACHINE\SOFTWARE\Microsoft\Microsoft SQL Server\MSSQL10.(InstanceName)\MSSQLServer\SuperSocketNetLib\TCP\IPAll

Soln 3# Error Log
Query the error log as below to get the port number.

EXEC xp_readerrorlog 0,1,”Server is listening on”,Null

Soln 4# Command Prompts
Execute the below command from the command prompt.

Netstat -abn
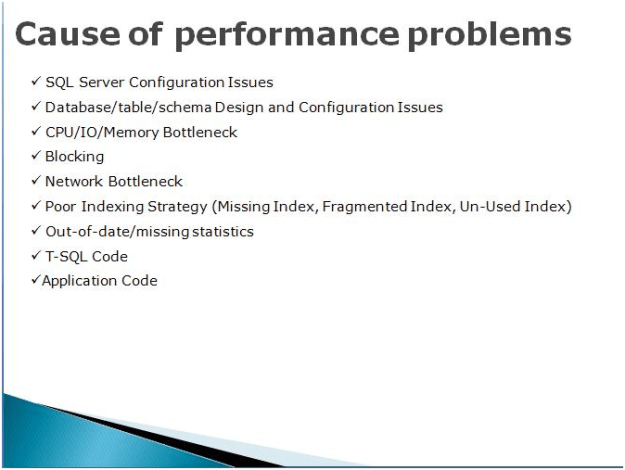
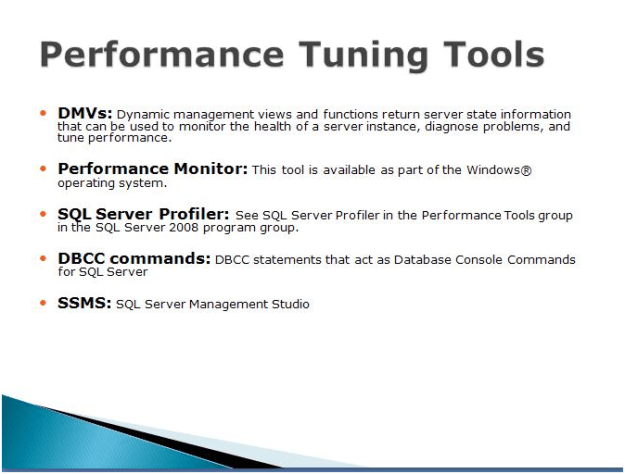
Performance Tuning Series

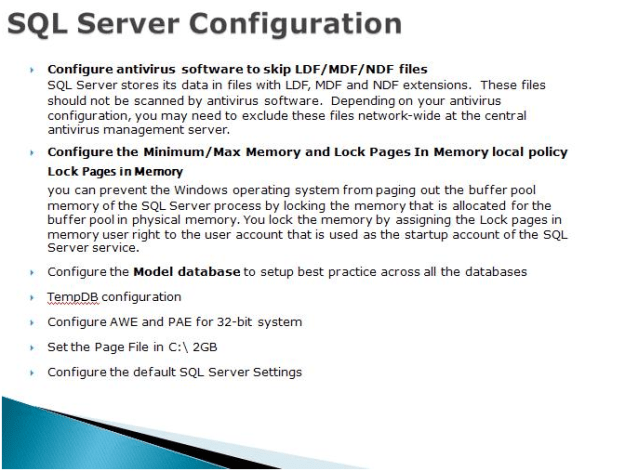
Lock Pages in Memory

You can prevent the Windows operating system from paging out the buffer pool memory of the SQL Server process by locking the memory that is allocated for the buffer pool in physical memory. You lock the memory by assigning the Lock pages in memory user right to the user account that is used as the startup account of the SQL Server service.

Model Database Whenever we create a new database, it will use model as template. Configure model DB for the Auto Shrink OFF, Auto Update/Create Statistics on

Maximum Worker Threads: Based on the load increase the maximum work thread.

Address Windowing Extensions (AWE) is an API that allows a 32-bit application to manipulate physical memory beyond 4 GB memory limit. The AWE mechanism technically is not necessary on 64-bit platform. It is, however, present there. Memory pages that are allocated through the AWE mechanism are referred as locked pages on the 64-bit platform.

On both 32-bit and 64-bit platforms, memory that is allocated through the AWE mechanism cannot be paged out. This can be beneficial to the application. (This is one of the reasons for using AWE mechanism on 64-bit platform.) This also affects the amount of RAM that is available to the system and to other applications, which might have detrimental effects. For this reason, in order to use AWE, the Lock Pages in Memory privilege must be granted for the account that runs SQL Server.


Please note:

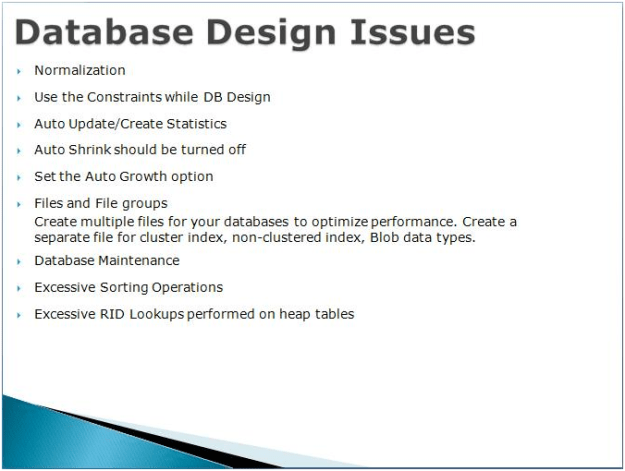
  • Turn auto-shrink off.
  • Make sure auto-update of statistics is turned on.
  • If a database is read only, set it to read only.
  • Use triggers very judiciously. They mostly operate in the background making them difficult to monitor and troubleshoot.
  • Be very careful of auto growth settings on the database. 10% auto growth will be fine when the database is 500mb. It makes a huge difference when the system is 50gb. For larger databases, change the setting to grow by a fixed amount rather than a percentage of total database size.
  • Files and FileGroups
  • Other factors that can affect the performance of your system include the way the files and file groups are laid out. You should be creating multiple files for your databases to optimize performance. A baseline for this would be to create one file for the logs, another for the data (defined by the clustered index), and another for non-clustered indexes. Additional files may be necessary to separate out BLOB data or XML data or unusually active tables, each onto its own file, and where possible, onto its own disk. This has been found to be true even on SAN systems because distributing the load takes further advantage of the architecture of the SAN.
  • Data Types
  • Define the data types that you need, not what you think you might need someday. A phone number is a string, not a number. Define the length of field that you need and enforce that length.

.

Basics of Replication Troubleshooting

There are many scenarios where you have been alerted for the replication failure and you have to troubleshoot the issue. In this article I will guide you what should be your approach to get the detailed error message and transaction details in replication.

First check the replication monitor and click on the failed publisher. Next step is double click on the failed subscriber from All Subscriptions list.

Now next step is click on the error and check its description.
Error :
Command attempted:
if @@trancount > 0 rollback tran
(Transaction sequence number: 0x0000044100002D93000100000000, Command ID: 1)

From the above error message we have to identify which command is failed to execute on the subscriber.

To get the exact command, find out the distributer server and distribution database for the failed publisher.

Once you get the distribution database server, execute the below query against the distribution DB.

use distribution
go
SELECT * FROM msrepl_commands
WHERE xact_seqno = 0x0000044100002D93000100000000
AND command_id = 1

Once you execute the above query against the distribution database, you will get the more information about the error, for example Publisher database ID, Article ID and much more…

We have to use the above details, to get the exact command using either SP_BROWSEREPLCMDS (If CLR is enabled) or you can cast the command column in msrepl_commands table.

We will check both the alternatives.

Using SP_BROWSEREPLCMDS
Please note CLR must be enabled for to use this procedure.

EXEC SP_BROWSEREPLCMDS
@xact_seqno_start = '0x0000044100002D930001',
@xact_seqno_end = '0x0000044100002D930001',
@publisher_database_id = 1033,
@article_id = 12,
@command_id= 1

By casting command column in msrepl_commands table

Please note if you want to see the better output use the Result to Text as output in SSMS (CTRL + T)

SELECT CAST(SUBSTRING(command, 7, 8000) AS NVARCHAR(MAX))
FROM msrepl_commands
WHERE xact_seqno = 0x0000044100002D930001
AND command_id = 1

Now you got the exact SQL Command. As a next step check the objects from both the publisher and the subscriber to see the violation of the keys or do the data comparisons etc.

Script to Monitor the Running Job Status

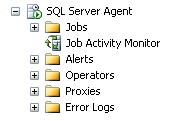
Think of environment where multiple jobs are running at the same time and you want to monitor the current status of each job. One option is to use the job activity monitor.


And another way is you can use the below system stored procedures by running it against the MSDB database.


exec msdb..sp_get_composite_job_info
@execution_status=1

exec msdb.dbo.sp_help_job
@execution_status = 1


You can check the job execution status parameter values as below.

0 = Not idle or suspended

1 = Executing

2 = Waiting For Thread

3 = Between Retries

4 = Idle

5 = Suspended

6 = Waiting For Step To Finish

7 = Performing Completion Actions